
Skip to content

US Economy · Weekly · Issue E-2026-11-07

The strong and the strained

Weekly U.S. economic developments report. Reporting window: October 31 to November 6, 2026 (U.S. Eastern). Data cutoff November 7, 2026 at 7:30 AM ET. Revision 1.

Executive takeaways

Firm activity, a stronger jobs report, and costly capital.

The week delivered firm activity data, a stronger labor report, and broad purchasing-manager expansion. The trade-off is stubborn price pressure and high absolute borrowing costs, which still divide well-capitalized buyers from everyone else.

  1. 01

    October payrolls rose 165,000 and unemployment held at 4.1%, a marked improvement from September’s low payroll gain. Professional and business services added 70,000 jobs, including 33,000 in professional, scientific, and technical services.12

  2. 02

    Growth is firm: the advance estimate put real GDP growth at 3.4% annualized in Q3, and Atlanta Fed GDPNow estimated Q4 growth at 3.4% on November 4. September real PCE barely rose, however, because a 0.5% PCE-price increase absorbed most of a 0.5% nominal spending increase.345

  3. 03

    Both major ISM surveys remained expansionary in October. Manufacturing reached 55.5 and services 54.5, but prices indexes remained elevated, especially in services. This is activity strength with an inflationary aftertaste.67

  4. 04

    The September trade deficit narrowed only slightly to $105.0 billion as exports and imports both rose. Construction spending fell 1.9% in September, evidence that rate-sensitive real activity is still taking the hits.810

  5. 05

    For M&A, credit spreads are not signaling recession, yet the risk-free curve, mortgage rates, and capital requirements remain restrictive. Quality software assets can transact; narratives without durable cash conversion will meet a less romantic audience.131425

Key metrics

Ten numbers that set the week.

Latest readings for the reporting week, with 1-, 3-, and 12-month changes where a consistent public series exists.

  • Real GDP

    3.4% SAAR

    2026 Q3; Oct. 29, 8:30 EDT

    1m
    –
    3m
    +1.2 pp
    12m
    +0.9 pp

    Growth accelerated4

  • GDPNow

    3.4% SAAR

    2026 Q4; Nov. 4 update

    1m
    –
    3m
    –
    12m
    –

    Nowcast firm5

  • Payrolls

    +165k

    Oct.; Nov. 6, 8:30 EST

    1m
    +137k
    3m
    +114k
    12m
    –

    Hiring improved1

  • Unemployment

    4.1%

    Oct.; Nov. 6, 8:30 EST

    1m
    -0.10 pp
    3m
    +0.00 pp
    12m
    -0.30 pp

    Stable / lower1

  • PCE price index

    +0.5% m/m

    Sep.; Oct. 29, 8:30 EDT

    1m
    +0.5%
    3m
    –
    12m
    –

    Monthly pressure3

  • ISM manufacturing

    55.5

    Oct.; Nov. 2, 10:00 ET

    1m
    +1.0 pt
    3m
    –
    12m
    –

    Expansion quickened6

  • ISM services

    54.5

    Oct.; Nov. 4, 10:00 ET

    1m
    -0.4 pt
    3m
    –
    12m
    –

    Expansion continued7

  • Trade deficit

    $105.0bn

    Sep.; Nov. 4, 8:30 ET

    1m
    -$0.7bn
    3m
    –
    12m
    –

    Deficit remains wide10

  • Consumer confidence

    91.7

    Oct.; Oct. 27, 10:00 ET

    1m
    +7.5 pt
    3m
    –
    12m
    –

    Rebounded16

  • Small-business optimism

    97.9

    Sep.; Oct. 13

    1m
    -0.8 pt
    3m
    –
    12m
    –

    Below long-run average17

Changes are 1-, 3-, and 12-month comparisons only where a consistent public series was available. Percentage-point changes apply to rates. Daily and weekly charts use monthly averages for comparisons, with no interpolation. Latest release timestamps distinguish the reporting-week news from the latest available observation.

The data, by theme

Eight areas, with the charts behind them.

Each chart compares the current 12-month window with the aligned prior period. The data table at the end of this section gives the values as text.

01

GDP, demand, and nowcasts

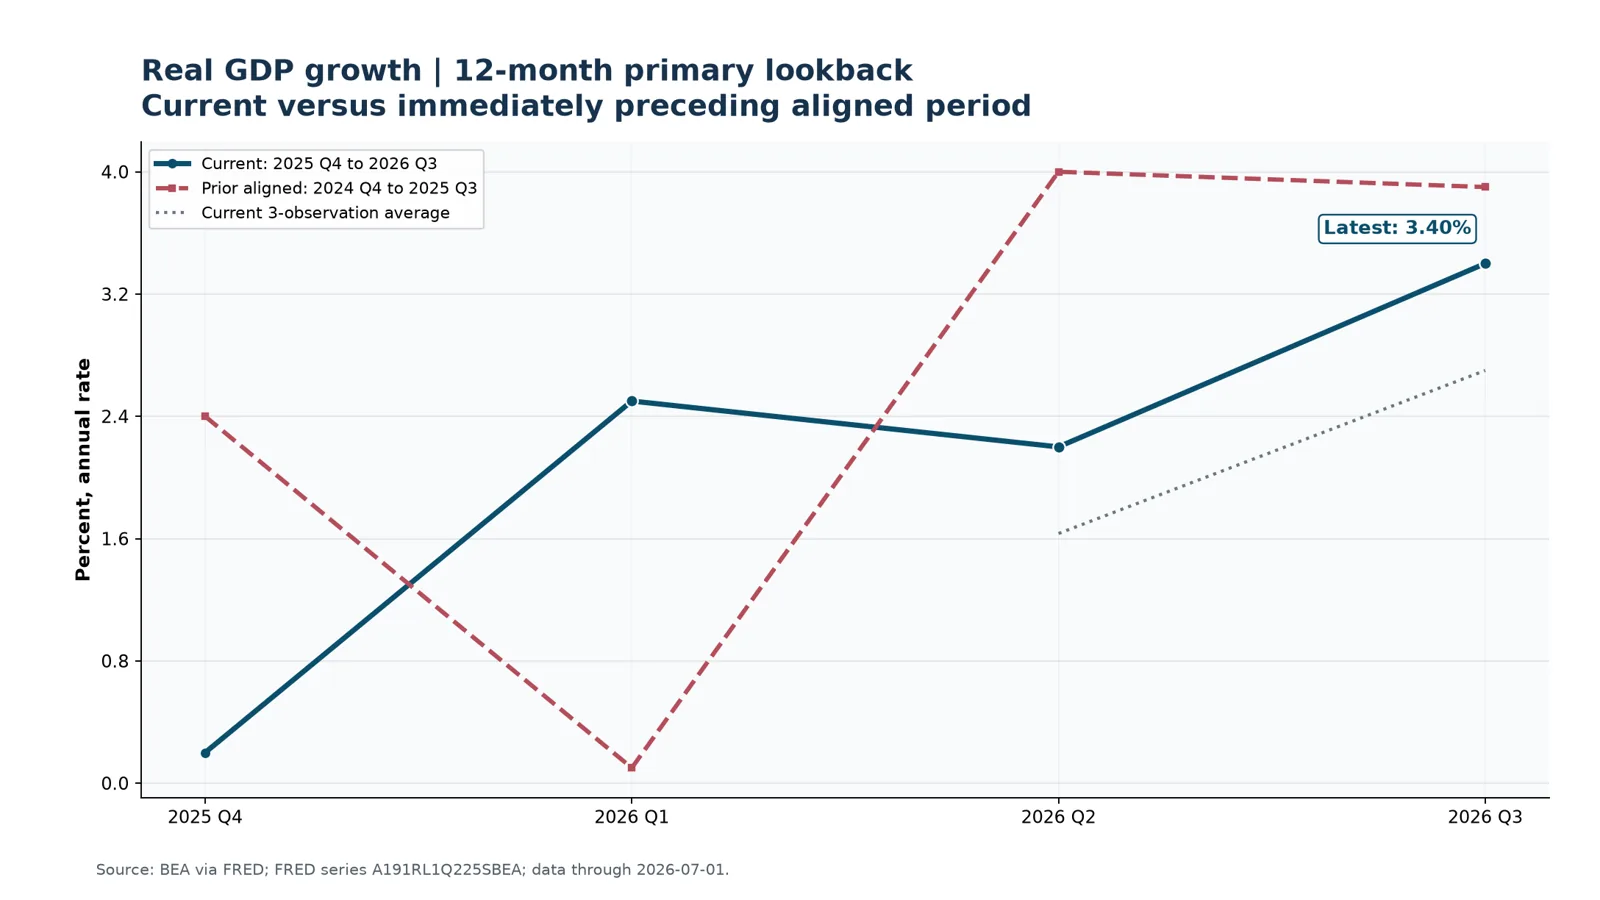
The week began with a high bar for recession narratives. The BEA advance estimate showed real GDP rose 3.4% at an annual rate in the third quarter, after 2.2% in Q2. The Atlanta Fed’s November 4 GDPNow reading put Q4 at the same 3.4% annualized pace. These are separate constructs: GDP is an official quarterly estimate; GDPNow is a mechanical, data-driven current-quarter estimate. Both describe firm aggregate activity.45

The September personal-income report makes the composition less comfortable. Nominal PCE rose 0.5%, but real PCE increased less than 0.1%; the PCE price index rose 0.5% and core PCE rose 0.3%. Demand is still advancing, but price growth is taking a larger share of the nominal gain.3

Chart: Real GDP growth. Current four-quarter window versus prior aligned four quarters. Values are in the chart data table.
Figure 1. Real GDP growth. Current four-quarter window versus prior aligned four quarters.24Data table

02

Labor market

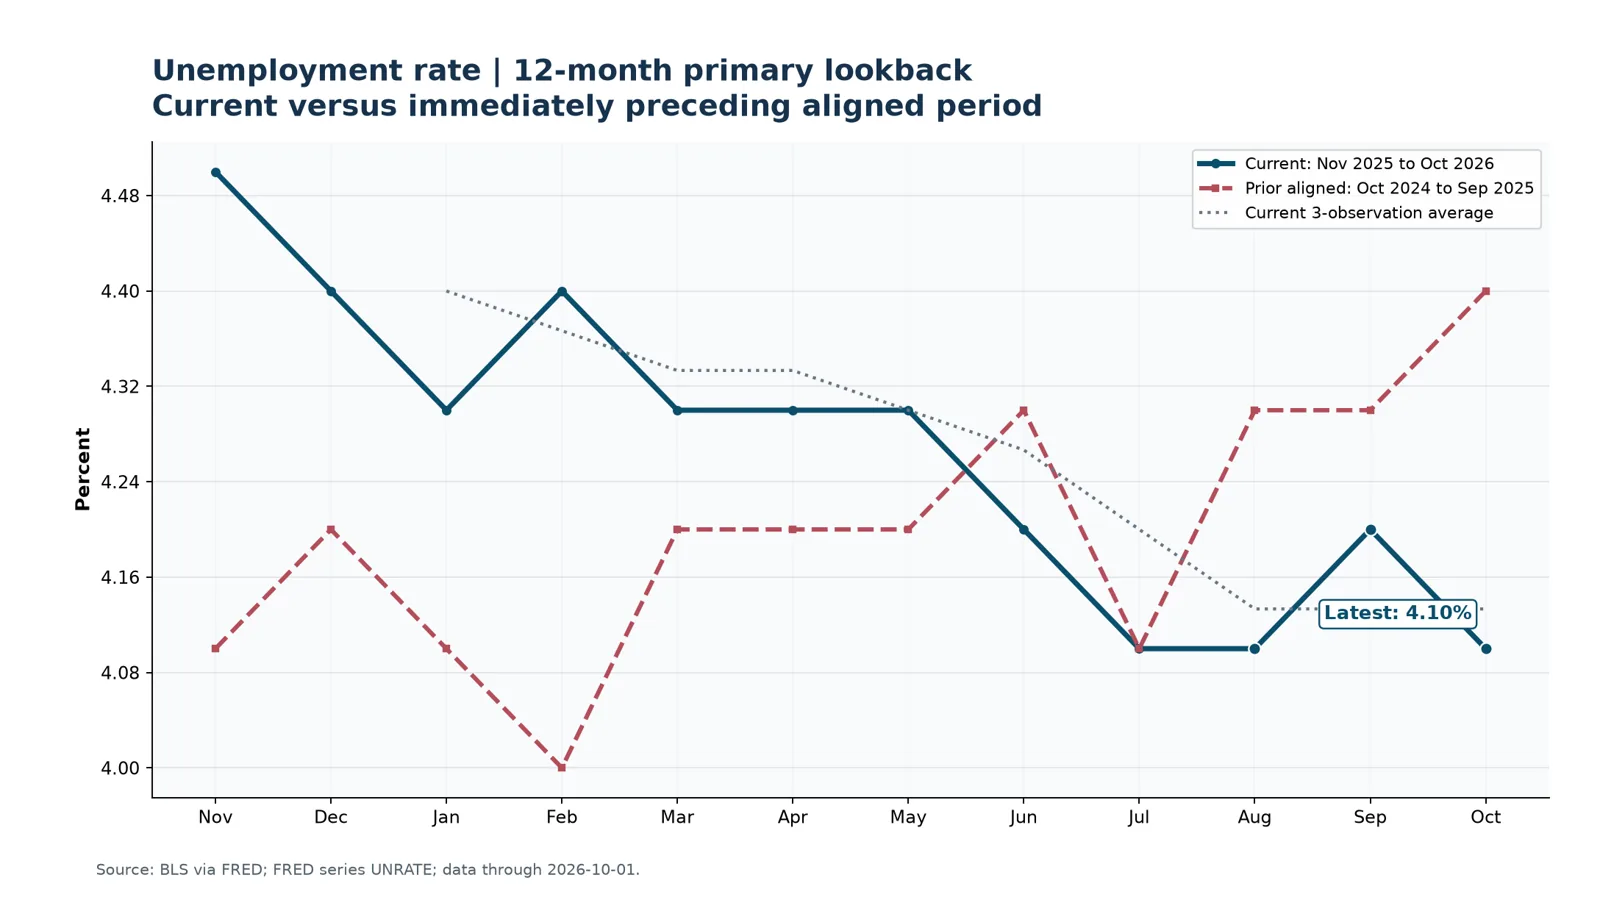
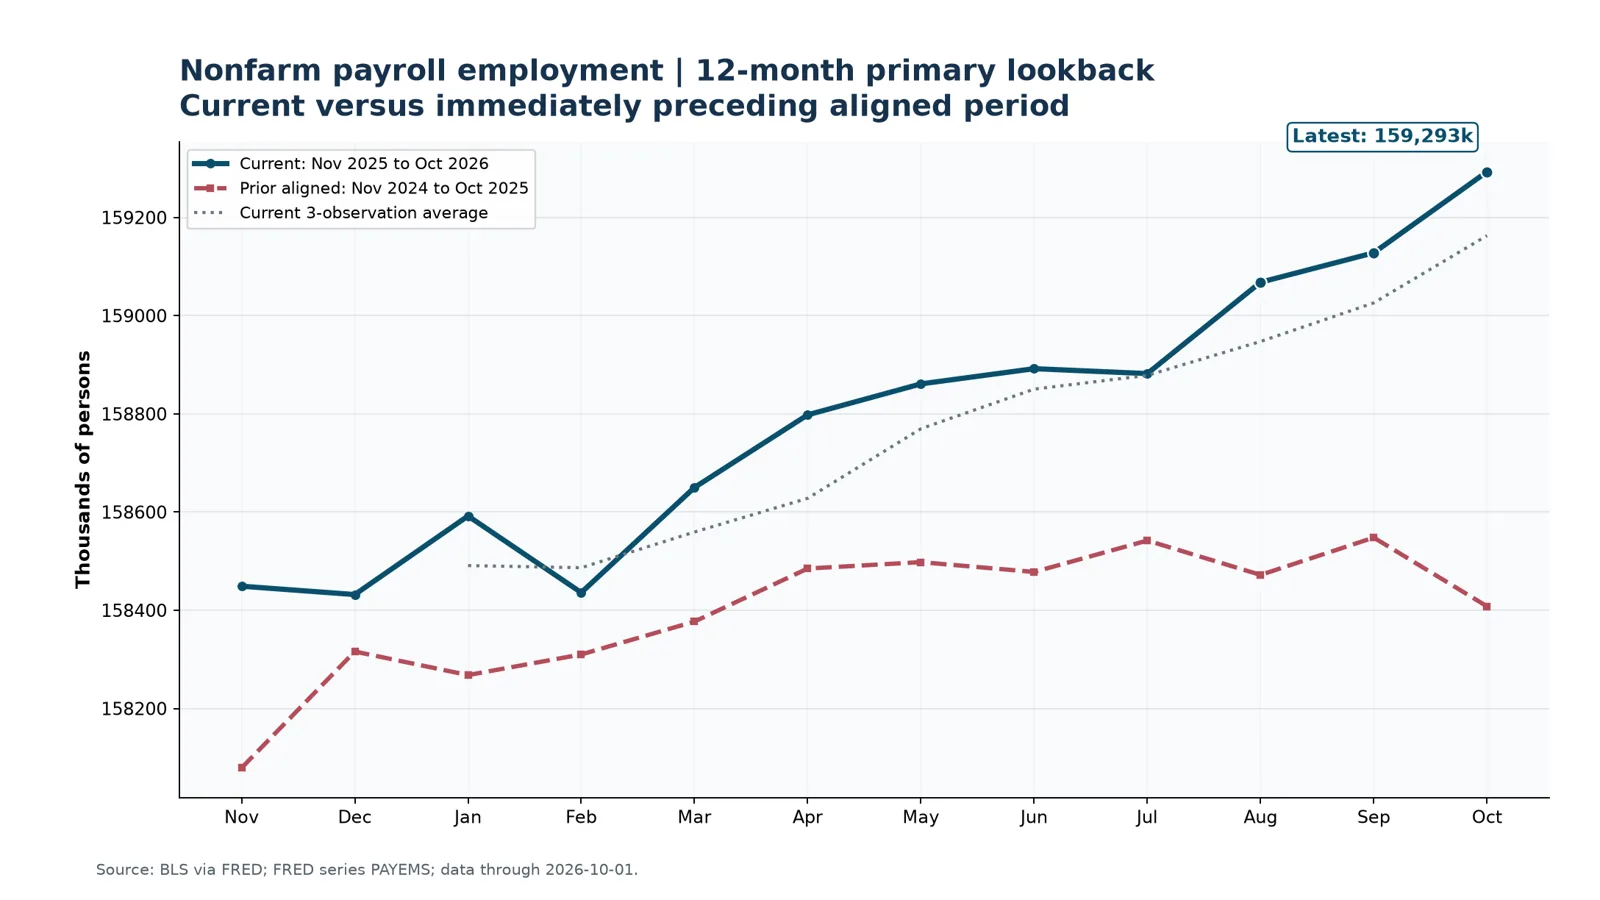
October payroll growth accelerated to 165,000, well above the prior 12-month average of 48,000, while unemployment held at 4.1%. Professional and business services led gains, with professional, scientific, and technical services adding 33,000. That is relevant to software and advisory demand because it points to continued payroll capacity in high-skill service employers.12

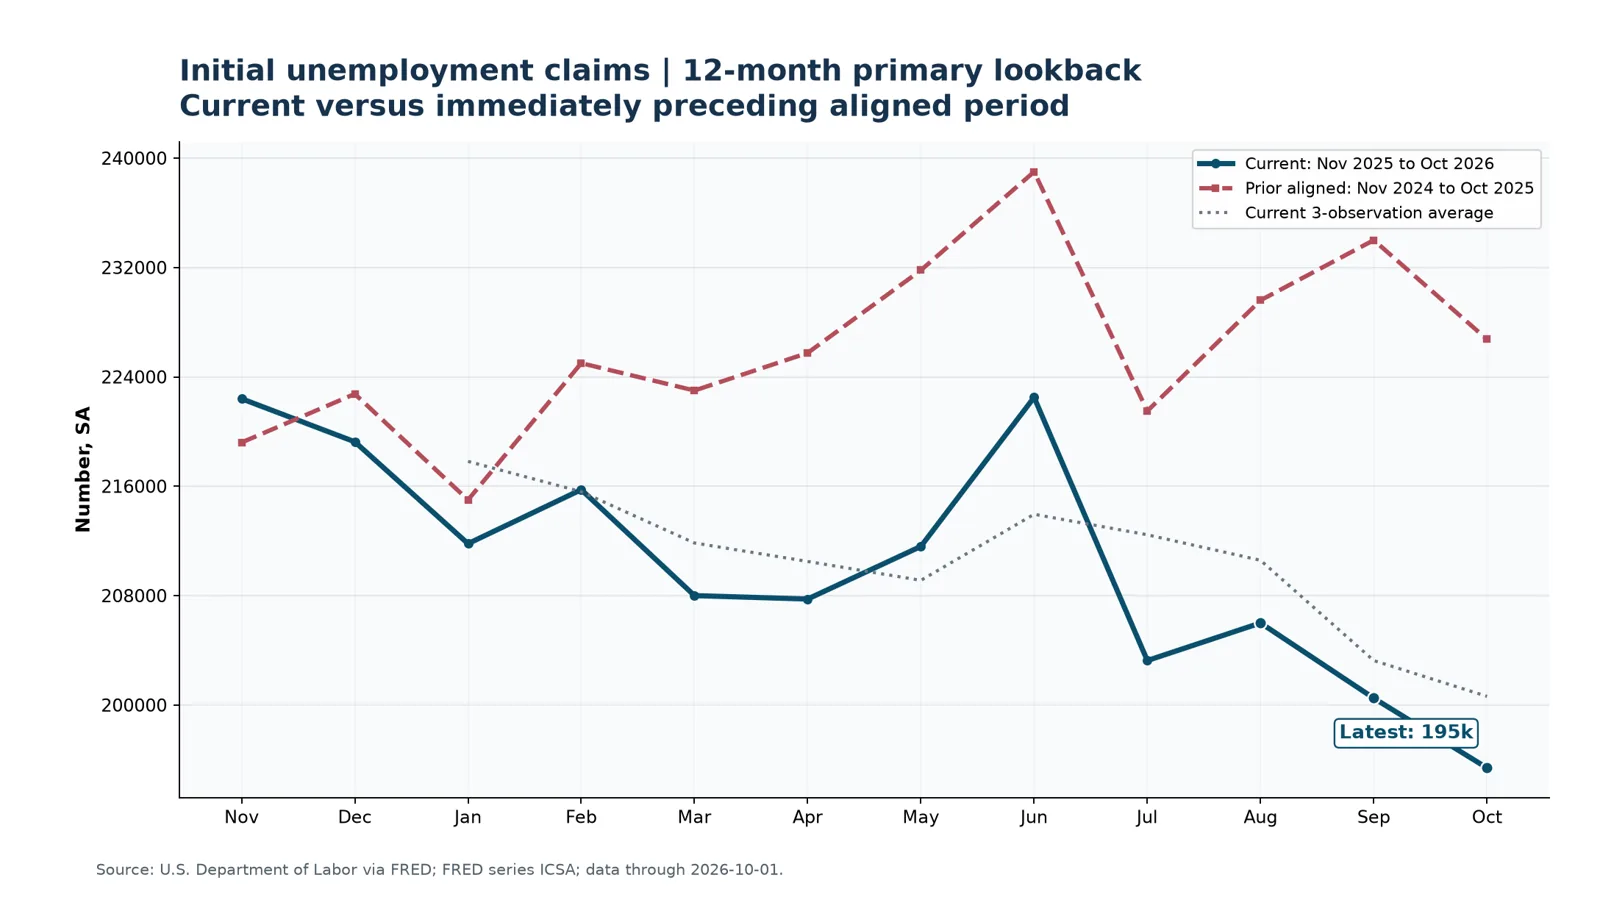
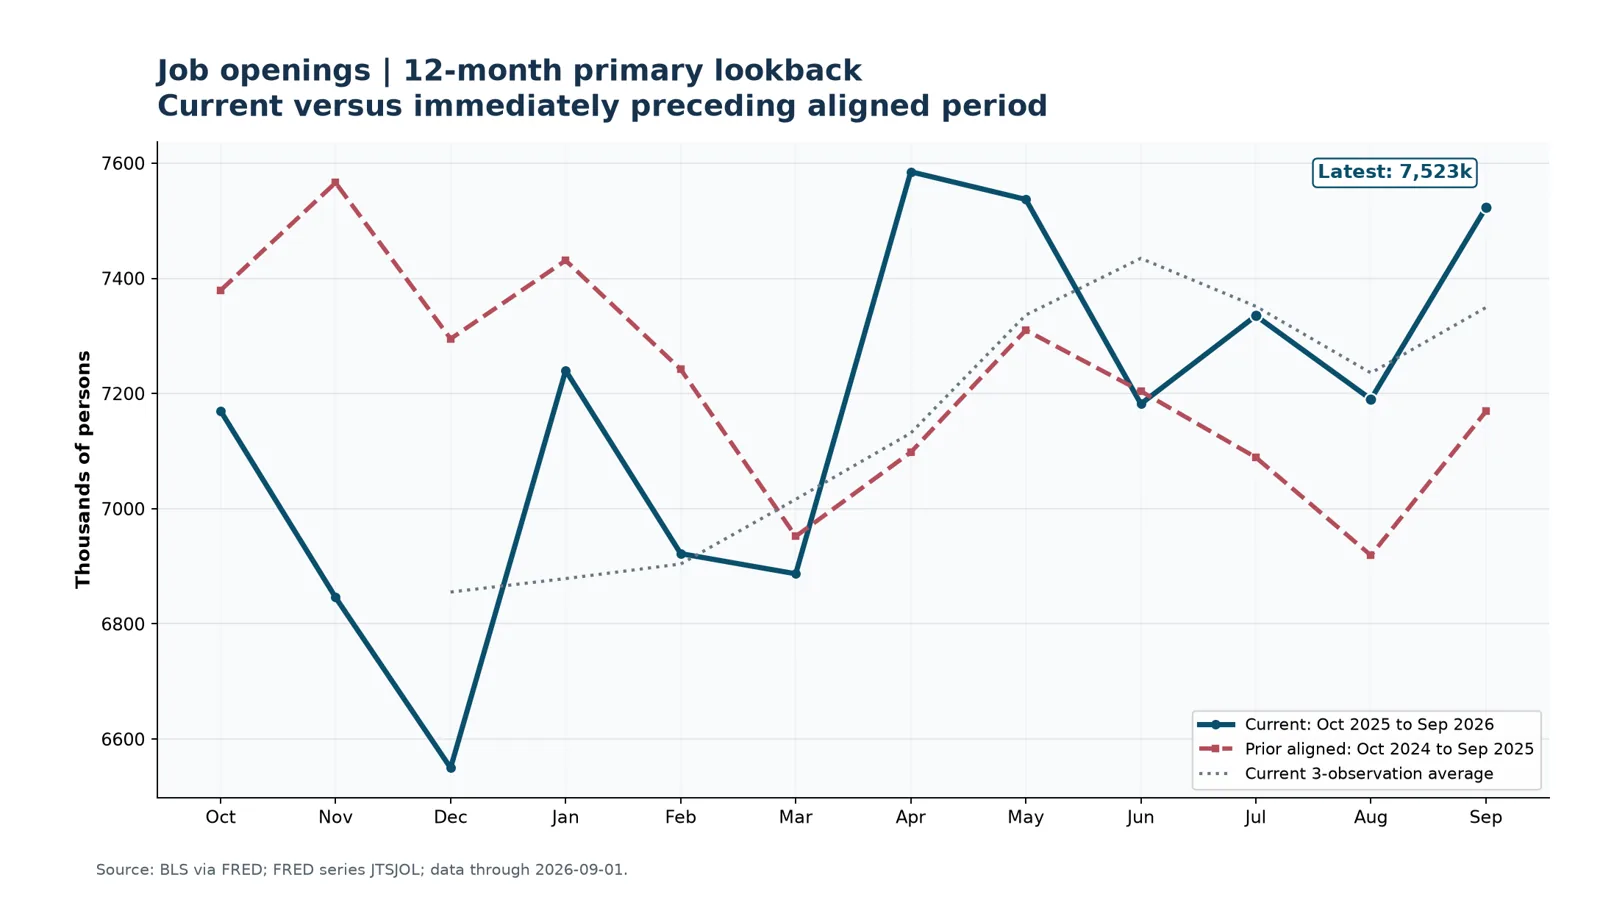
This release counters the September signal of near-stalled hiring, but it does not erase the low-turnover picture. August JOLTS reported 7.1 million openings, 5.2 million hires, 3.1 million quits, and 1.6 million layoffs and discharges. Claims remain the faster recession monitor; charted weekly initial claims are still low by recent-cycle standards.2126

Chart: Unemployment rate. Current 12 months versus prior aligned 12 months. Values are in the chart data table.
Figure 2. Unemployment rate. Current 12 months versus prior aligned 12 months.24Data table
Chart: Nonfarm payroll employment. Current 12 months versus prior aligned 12 months. Values are in the chart data table.
Figure 3. Nonfarm payroll employment. Current 12 months versus prior aligned 12 months.24Data table
Chart: Initial unemployment claims, monthly averages. Current 12 months versus prior aligned 12 months. Values are in the chart data table.
Figure 4. Initial unemployment claims, monthly averages. Current 12 months versus prior aligned 12 months.26Data table

03

Inflation and policy

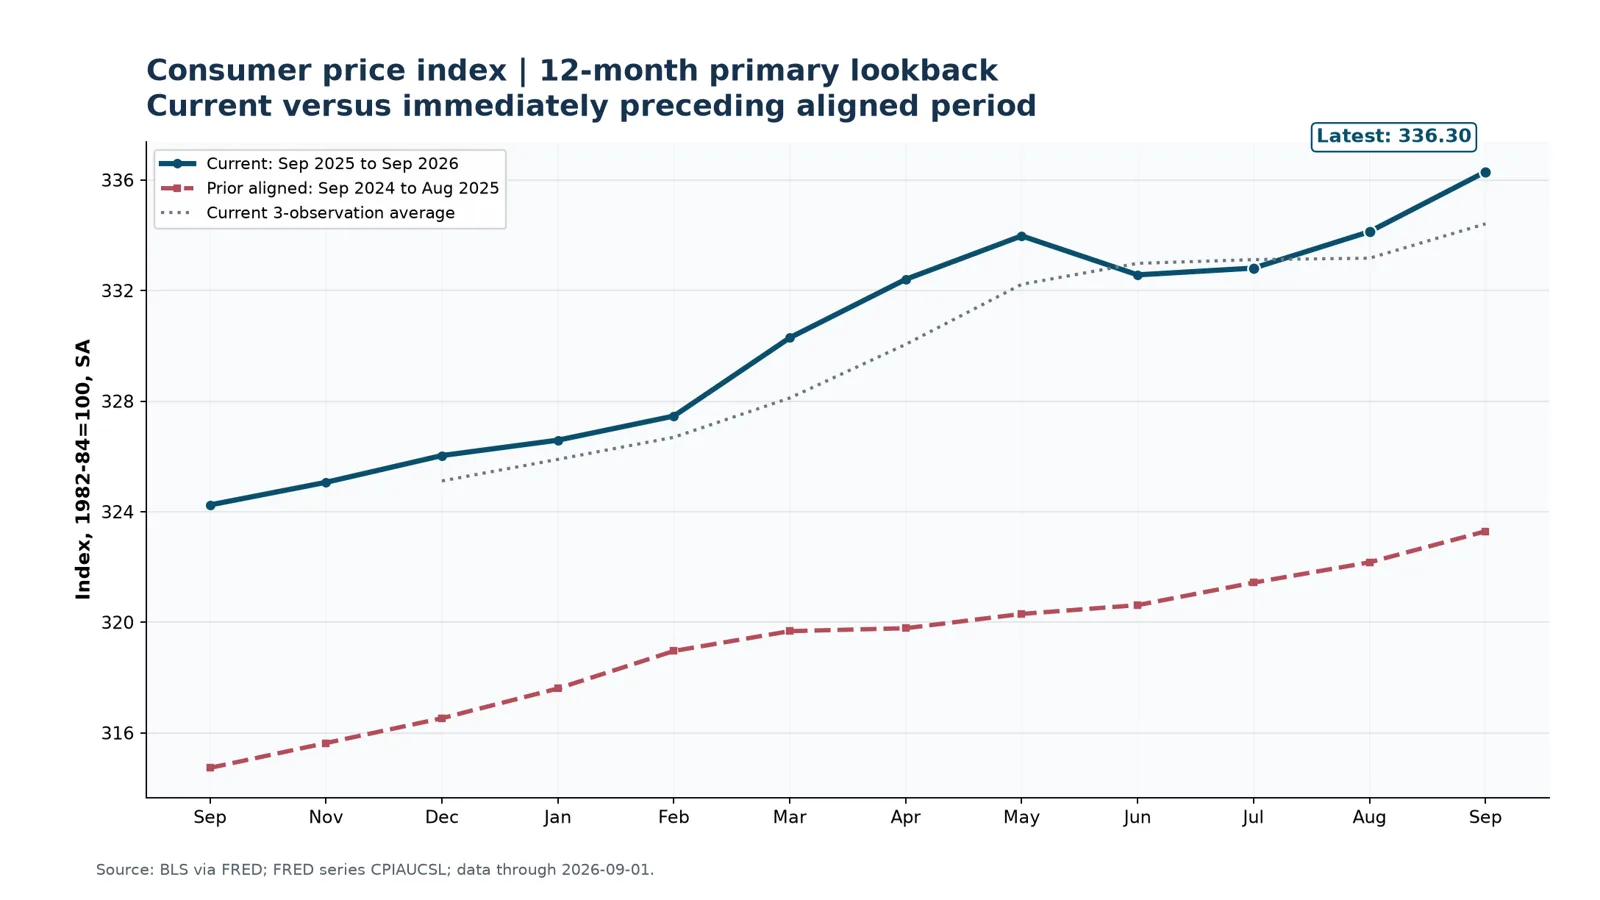
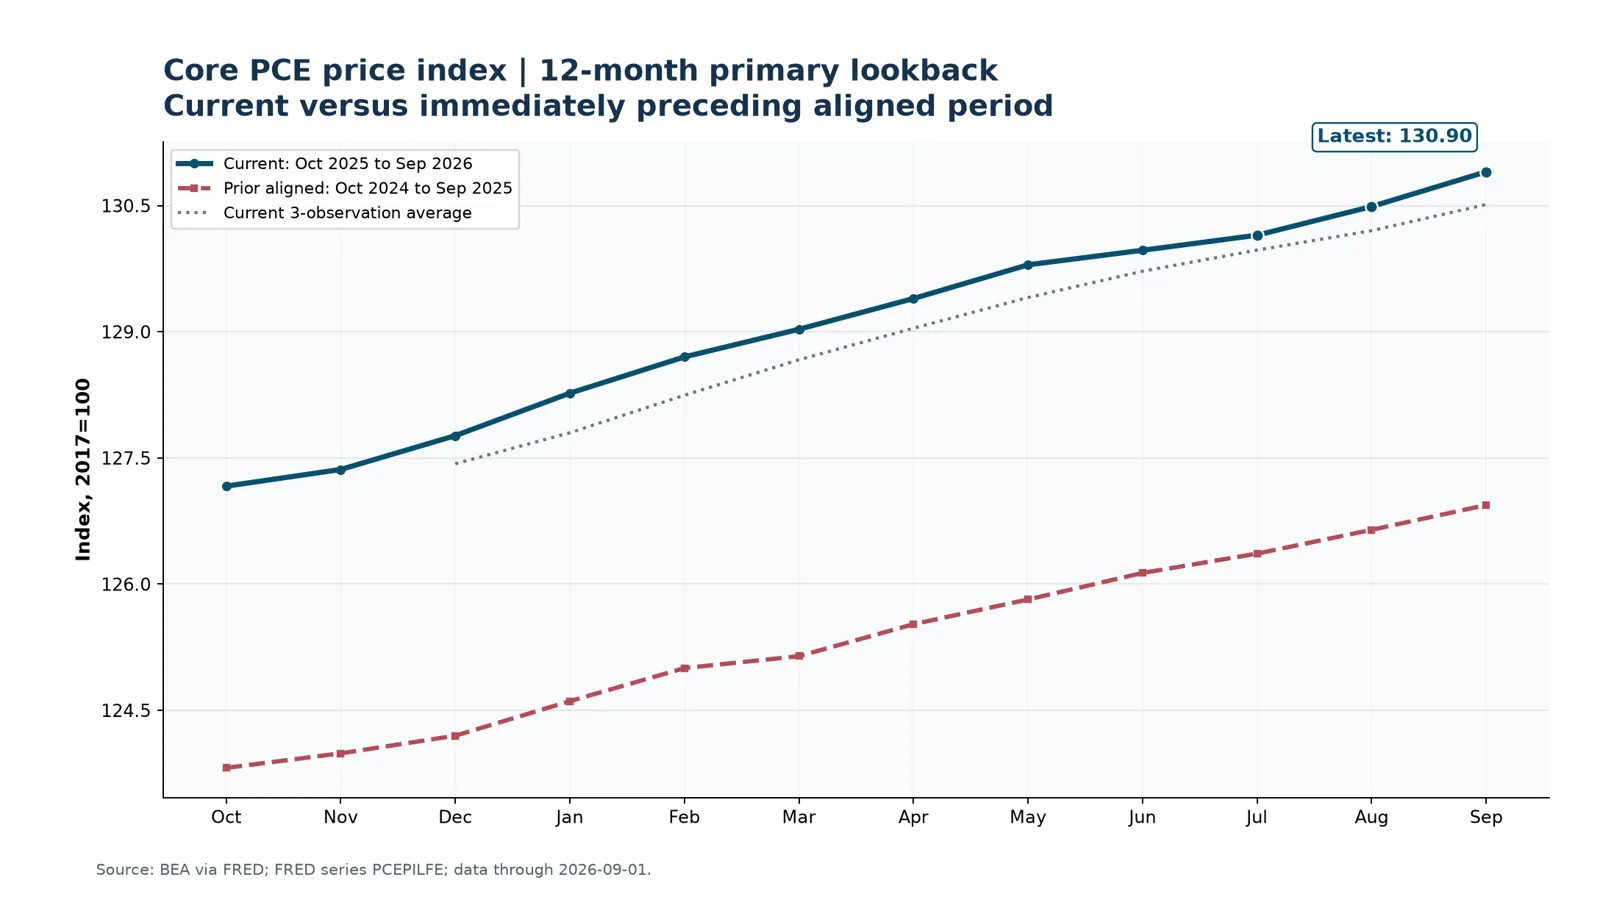
No CPI or PPI release fell inside the reporting week, so the report retains September as the latest official price reference: CPI and PPI were released October 14 and October 15, respectively. September PCE data arrived October 29 and showed a 0.5% monthly rise in the PCE price index and 0.3% in core PCE. The distinction matters: PCE is the Federal Reserve’s stated inflation gauge, while CPI remains the more immediate household-cost read.31920

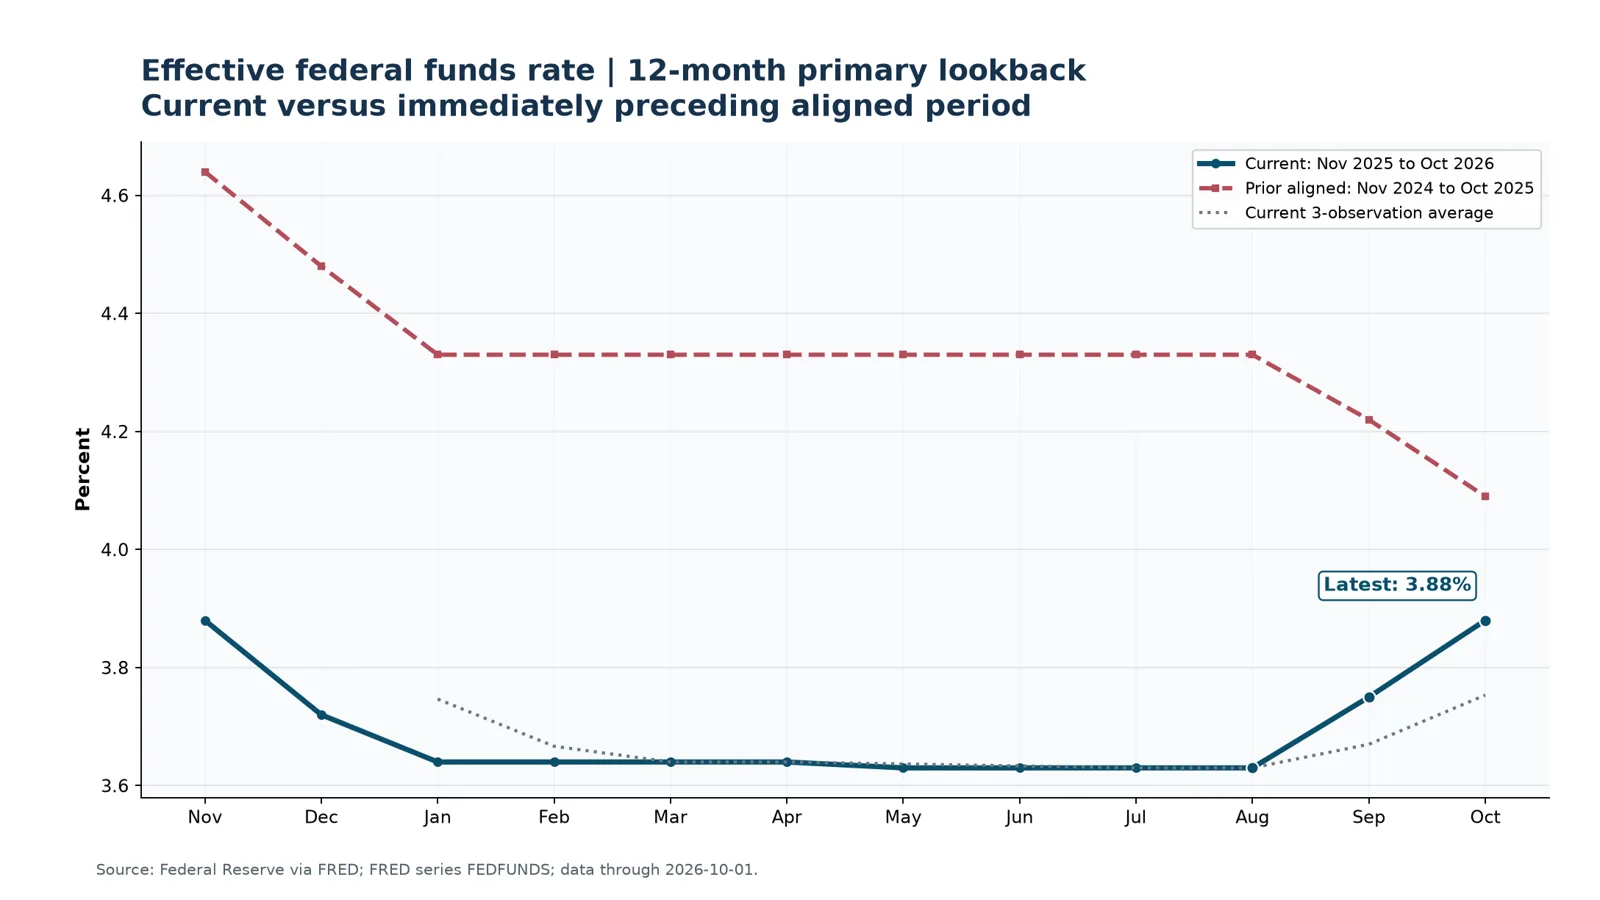
The FOMC held the federal-funds target range at 3.75% to 4.00% on October 28; its implementation note maintained the interest rate paid on reserve balances at 3.90% from October 29. With growth and survey activity firm, the evidence in this week’s data does not make an early retreat from restrictive policy easier to argue.1112

Chart: Seasonally adjusted CPI level. Current 12 months versus prior aligned 12 months. Values are in the chart data table.
Figure 5. Seasonally adjusted CPI level. Current 12 months versus prior aligned 12 months.24Data table
Chart: Core PCE price index level. Current 12 months versus prior aligned 12 months. Values are in the chart data table.
Figure 6. Core PCE price index level. Current 12 months versus prior aligned 12 months.24Data table
Chart: Effective federal funds rate. Current 12 months versus prior aligned 12 months. Values are in the chart data table.
Figure 7. Effective federal funds rate. Current 12 months versus prior aligned 12 months.24Data table

04

Rates, credit, and financial conditions

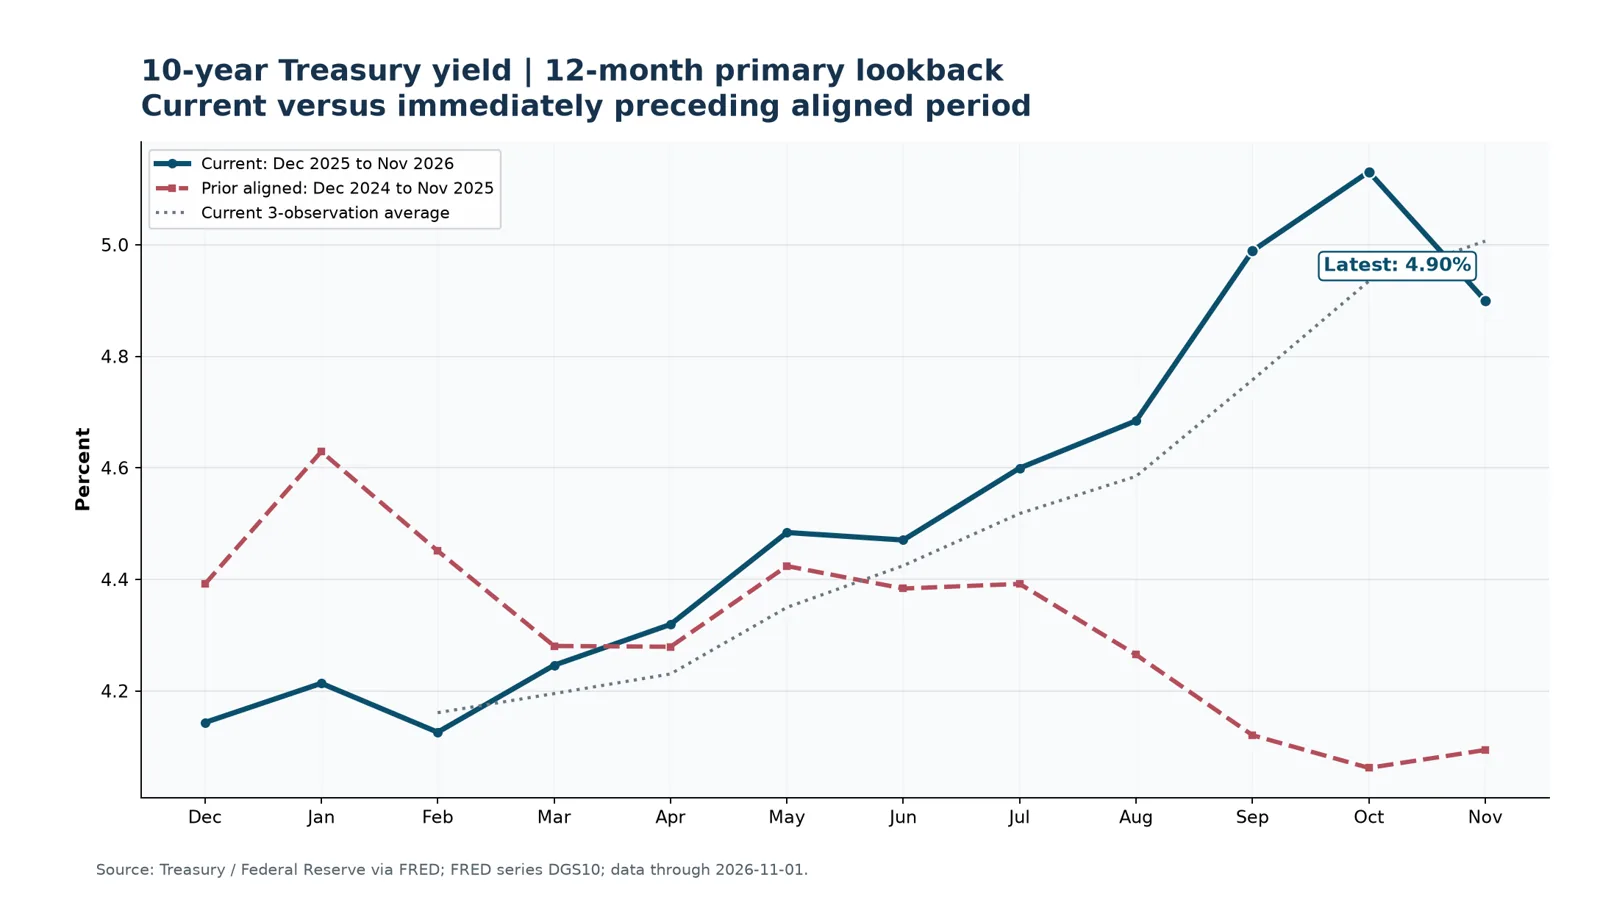
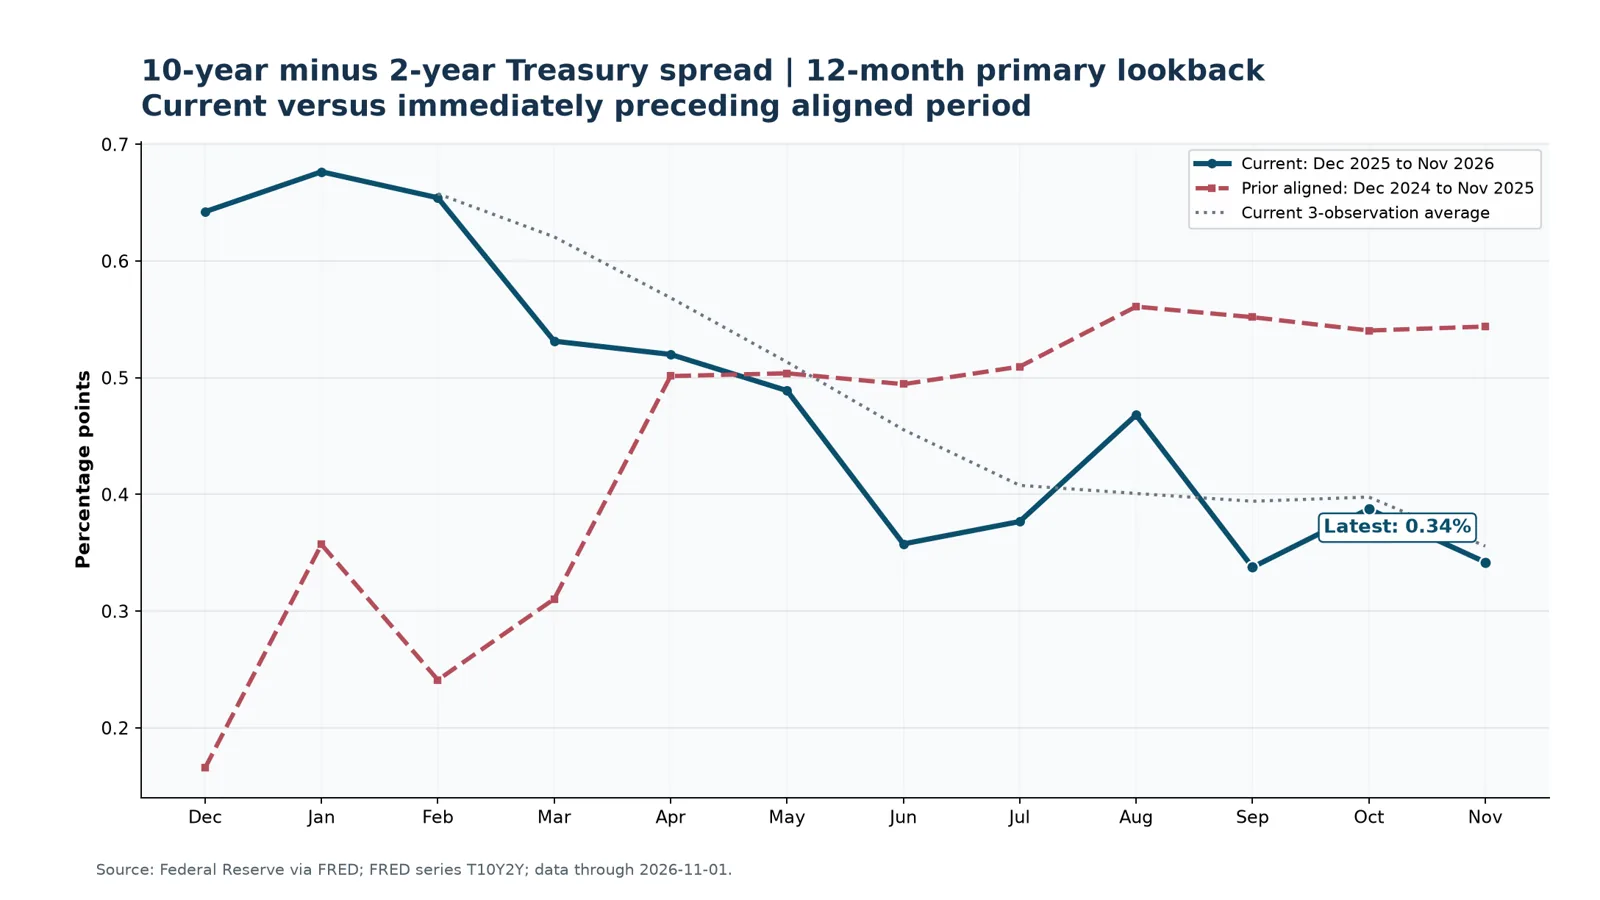
Treasury yields remain high in absolute terms. The Treasury’s curve is derived from closing bid-side quotes around 3:30 p.m. ET; charted ten-year and curve-spread measures therefore describe market pricing rather than a policy rate. The November Treasury Borrowing Advisory Committee noted the rise in the ten-year yield reflected capex-led growth and energy price shocks, with no clear evidence that tech-related issuance was crowding out Treasuries or non-tech credit.1327

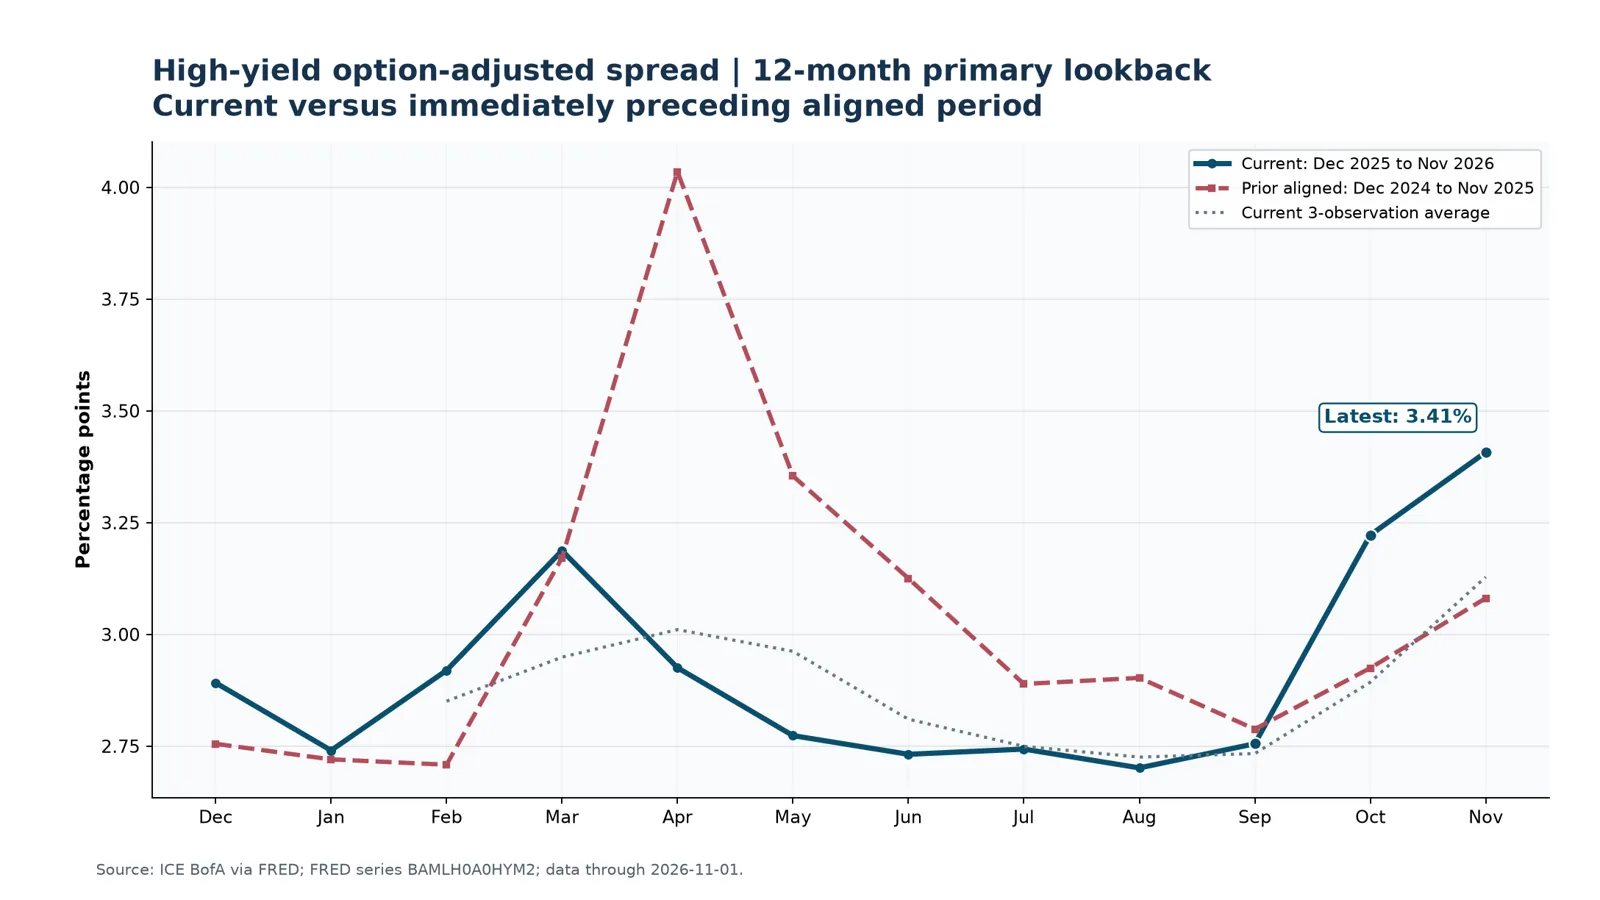
High-yield option-adjusted spreads remain contained, which is a reassuring signal about default risk, but spread calm does not make debt cheap. The risk-free base is still the part of the capital stack refusing to cooperate. Freddie Mac’s 30-year mortgage rate was 7.24% as of October 29, 107 basis points above a year earlier.1425

Chart: Ten-year Treasury yield, monthly averages. Current 12 months versus prior aligned 12 months. Values are in the chart data table.
Figure 8. Ten-year Treasury yield, monthly averages. Current 12 months versus prior aligned 12 months.24Data table
Chart: U.S. high-yield option-adjusted spread, monthly averages. Current 12 months versus prior aligned 12 months. Values are in the chart data table.
Figure 9. U.S. high-yield option-adjusted spread, monthly averages. Current 12 months versus prior aligned 12 months.25Data table
Chart: Ten-year minus two-year Treasury spread, monthly averages. Current 12 months versus prior aligned 12 months. Values are in the chart data table.
Figure 10. Ten-year minus two-year Treasury spread, monthly averages. Current 12 months versus prior aligned 12 months.24Data table

05

Housing and construction

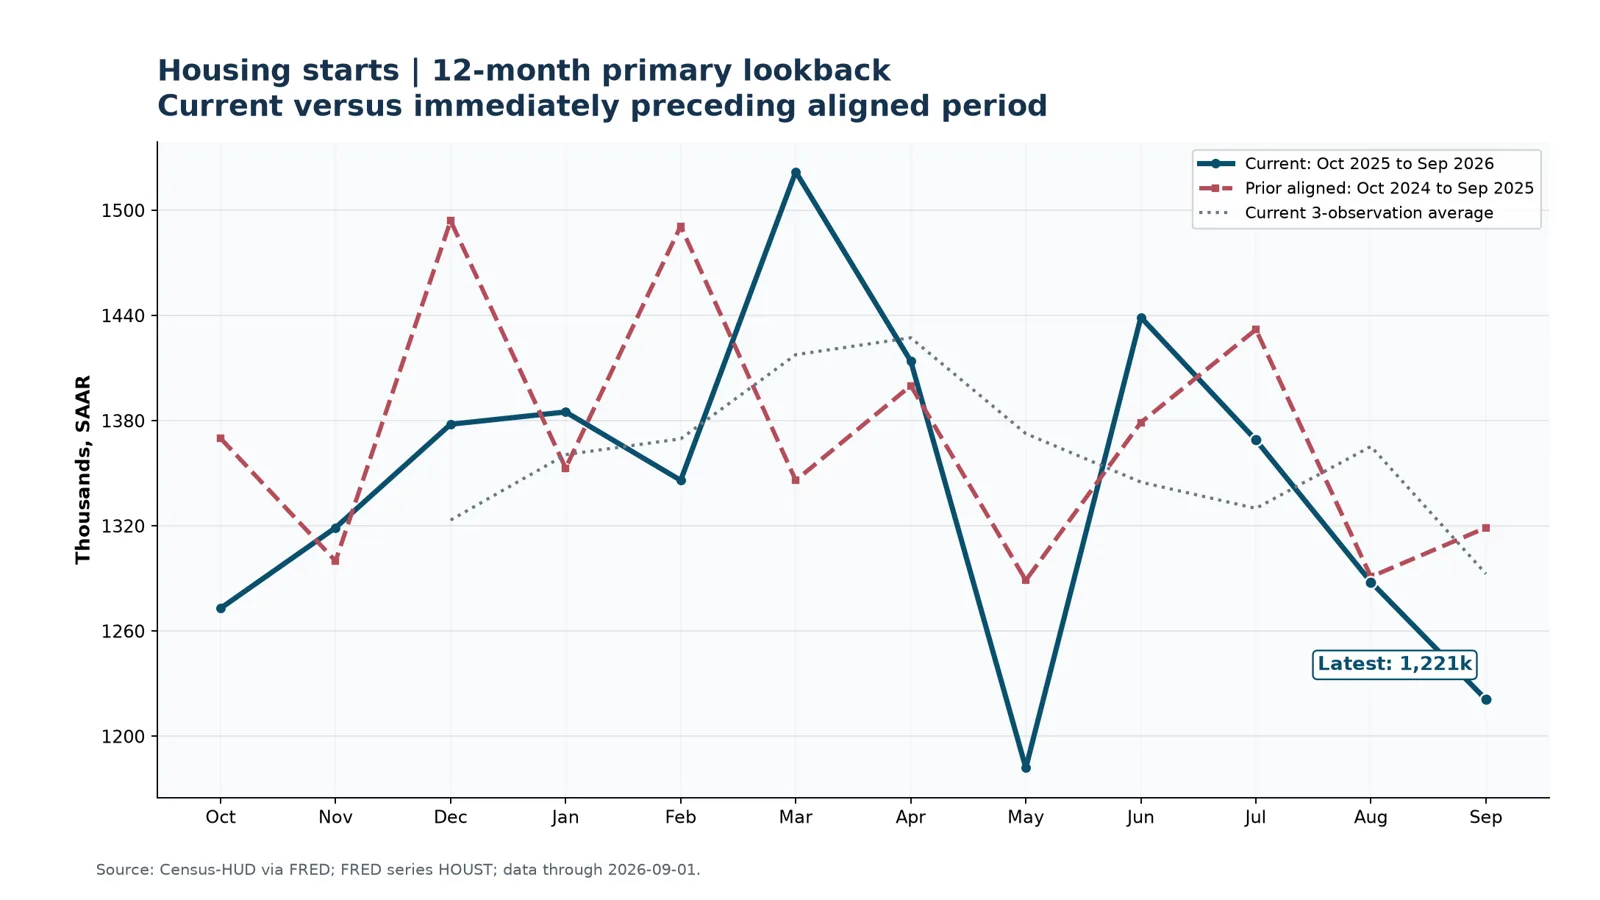
Housing remains the sector with the cleanest interest-rate transmission. Freddie Mac reported a 7.24% 30-year fixed rate on October 29. The latest Census-HUD housing-start data covered September, while construction spending released during the reporting week fell 1.9% in September. FHFA’s latest available home-price release, for July, showed prices still rising, so weak transactions and positive prices continue to coexist.8142223

That split has M&A consequences beyond residential real estate. Software vendors serving title, mortgage, homebuilding, property management, construction and small contractors face a softer volume environment even if asset values have not fallen enough to produce broad distress.814

Chart: Housing starts. Current 12 months versus prior aligned 12 months. Values are in the chart data table.
Figure 11. Housing starts. Current 12 months versus prior aligned 12 months.24Data table

06

Consumption and sentiment

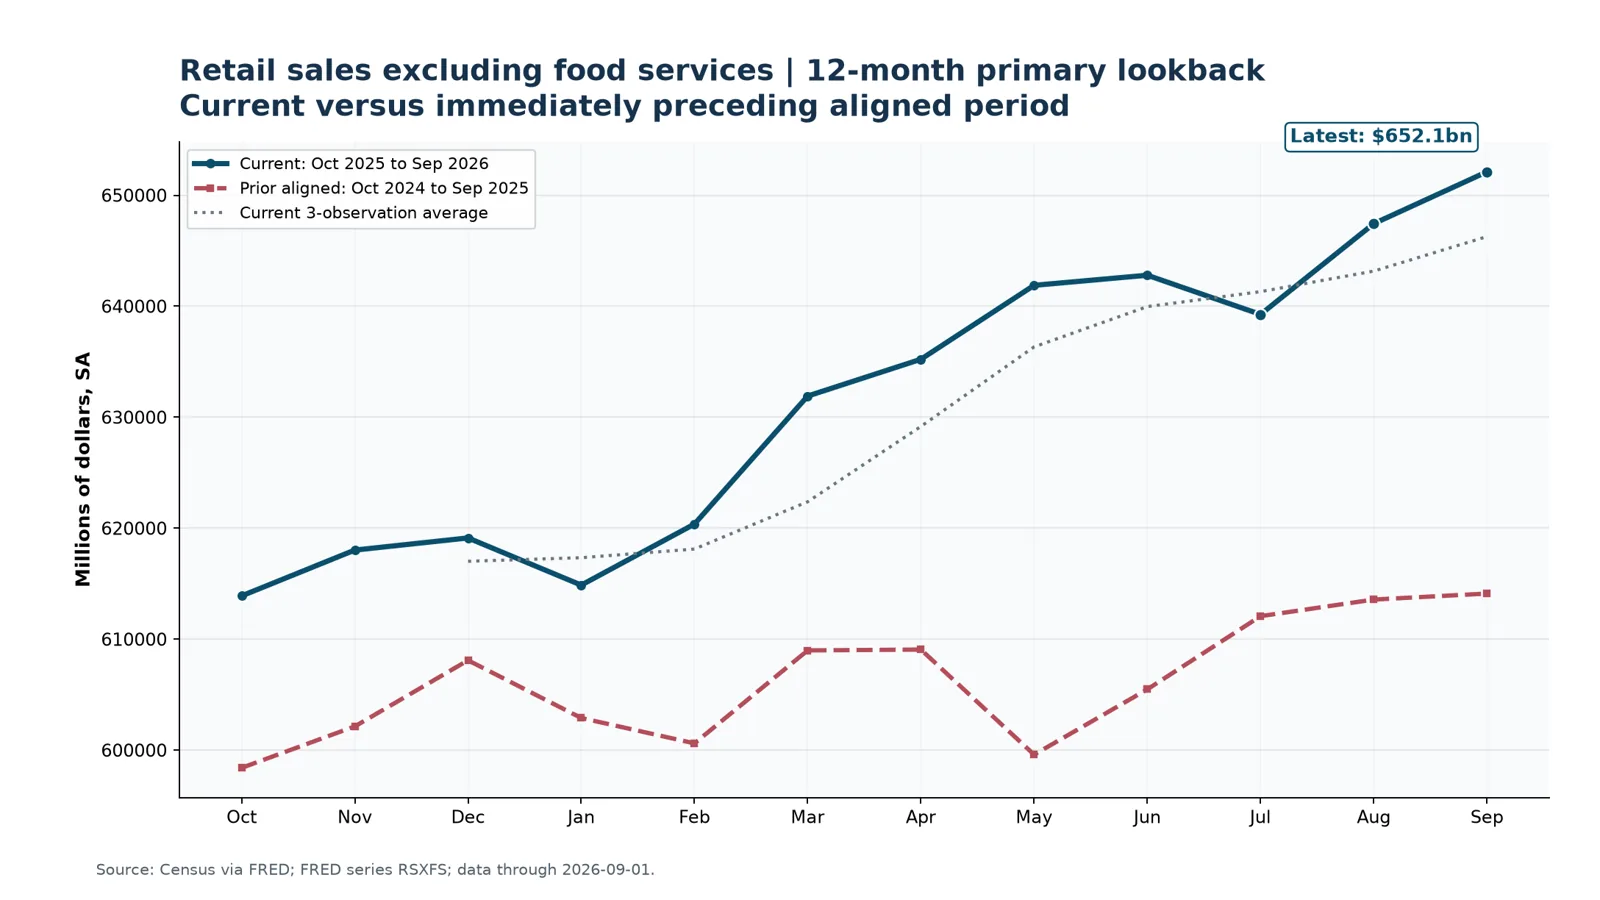
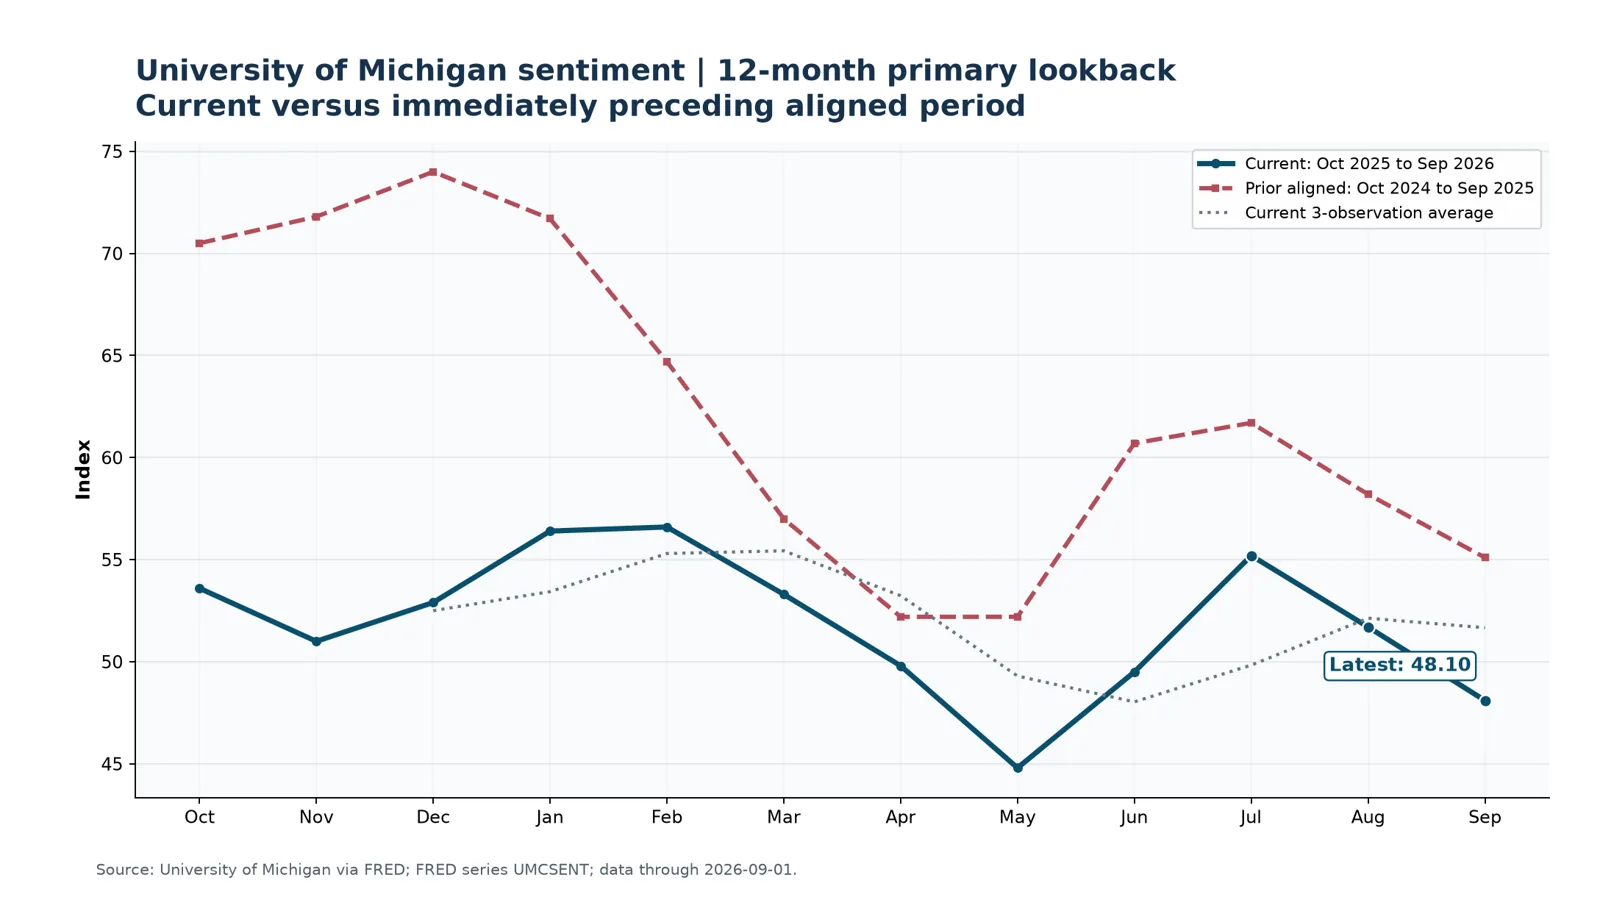
Hard spending and sentiment do not tell the same story. The Conference Board Consumer Confidence Index rose 7.5 points to 91.7 in October, with the present-situation index at 120.4 and expectations at 72.6. Michigan’s preliminary November sentiment reading was 51.0, up from October’s final 48.0. Both surveys improved from weak levels, although they measure different populations and question sets.1516

NFIB’s September small-business optimism index fell 0.8 point to 97.9, below its 52-year average of 98.0; uncertainty rose to 90. Four sentiment and survey signals are therefore covered this week: Conference Board confidence, Michigan sentiment, NFIB optimism, ISM manufacturing, and ISM services. Their common message is expansion with little margin for cost or financing mistakes.6717

Chart: Retail sales excluding food services, nominal and seasonally adjusted. Current 12 months versus prior aligned 12 months. Values are in the chart data table.
Figure 12. Retail sales excluding food services, nominal and seasonally adjusted. Current 12 months versus prior aligned 12 months.24Data table
Chart: University of Michigan consumer sentiment. Current 12 months versus prior aligned 12 months. Values are in the chart data table.
Figure 13. University of Michigan consumer sentiment. Current 12 months versus prior aligned 12 months.24Data table

07

Manufacturing and services

Manufacturing PMI rose to 55.5 in October from 54.5 in September. ISM’s own summary noted a sharp divergence between the expansionary index and downbeat respondent commentary, with prices at 75.2. Services PMI registered 54.5, its 28th consecutive expansion reading; the services prices index was 73.0. The two surveys point to broad activity, not a clean all-clear on cost pressure.67

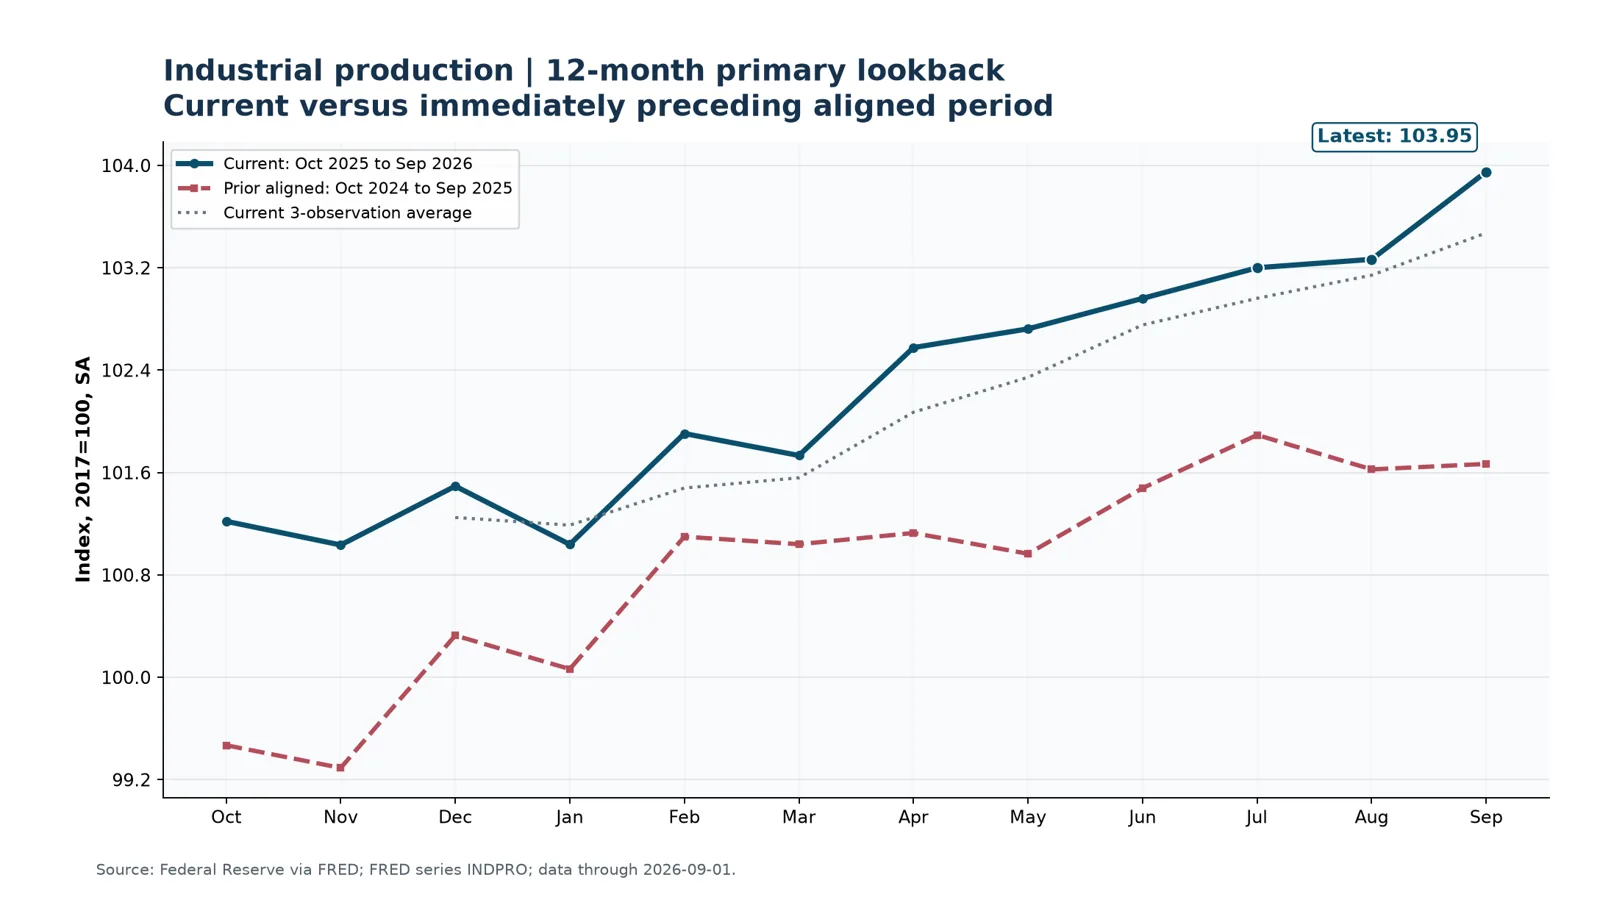
Census also reported September new orders for manufactured goods of $677.2 billion, up 1.8%. Industrial production provides the hard-output counterweight in the chart below; it should be read with the survey evidence rather than treated as a substitute for it.924

Chart: Industrial production. Current 12 months versus prior aligned 12 months. Values are in the chart data table.
Figure 14. Industrial production. Current 12 months versus prior aligned 12 months.24Data table

08

Trade, leading indicators, and divergences

The September goods-and-services deficit narrowed $0.7 billion to $105.0 billion, as exports rose $5.8 billion and imports rose $5.2 billion. Year to date, the deficit was 12.2% below the comparable 2025 period. Trade is a two-sided signal: higher imports demonstrate domestic demand and investment, but net exports may still subtract from GDP accounting.10

The Conference Board LEI was unchanged at 99.6 in September after a 0.1% decline in August; its six-month gain was 0.6%. The index’s positive contribution from the interest-rate spread was offset by consumer expectations, the S&P 500, and nondefense capital-goods orders. That combination justifies a mid-range recession estimate rather than either panic or complacency.18

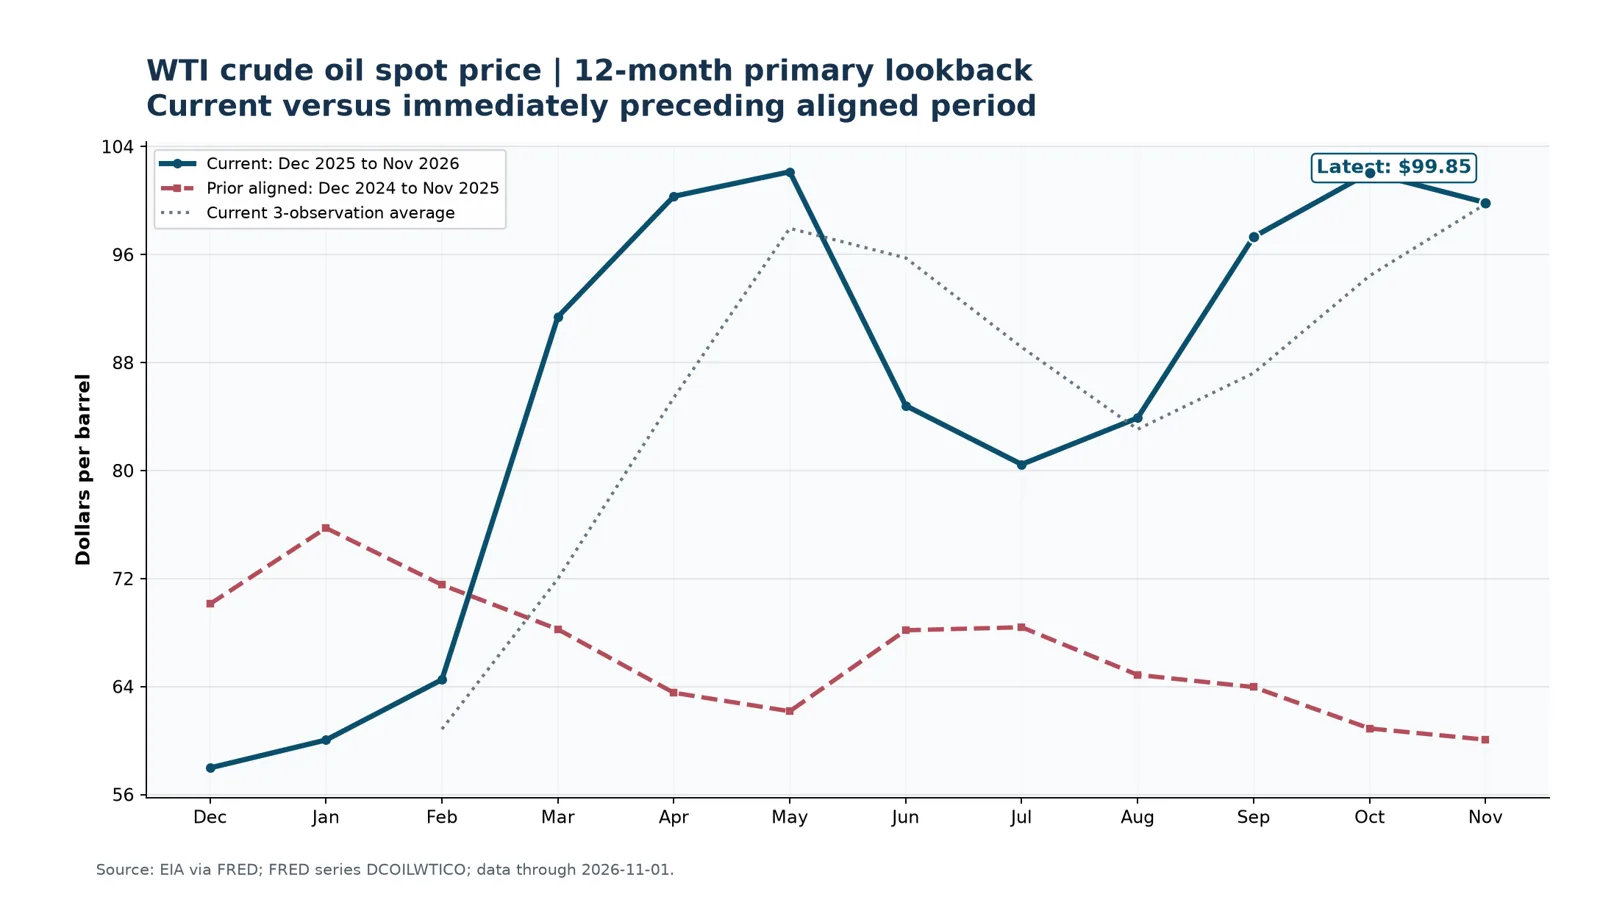
Chart: WTI crude oil spot price, monthly averages. Current 12 months versus prior aligned 12 months. Values are in the chart data table.
Figure 15. WTI crude oil spot price, monthly averages. Current 12 months versus prior aligned 12 months.24Data table
Chart: Job openings. Current 12 months versus prior aligned 12 months. Values are in the chart data table.
Figure 16. Job openings. Current 12 months versus prior aligned 12 months.24Data table
Chart data table (text equivalent of all 16 charts)

Method. Each chart has a fixed 16:9 canvas and shows a 12-month current window against the same observation index in the immediately preceding 12-month period. Quarterly GDP uses four quarters. The dotted line is a three-observation moving average and is not used to interpolate values. Daily and weekly series are calendar-month averages for comparability; all other values retain their published frequency. Percentage comparisons use levels where appropriate and percentage-point changes for rates and spreads.

SeriesMetricLatest obs.Latest1m3m12m
A191RL1Q225SBEAReal GDP growth2026-07-013.40%+1.20 pp+3.20 pp-1.10 pp
UNRATEUnemployment rate2026-10-014.10%-0.10 pp+0.00 pp-0.30 pp
PAYEMSNonfarm payroll employment2026-10-01159,293k+0.1%+0.3%+0.6%
CPIAUCSLConsumer price index2026-09-01336.30+0.6%+1.1%+4.0%
PCEPILFECore PCE price index2026-09-01130.90+0.3%+0.7%+3.1%
FEDFUNDSEffective federal funds rate2026-10-013.88%+0.13 pp+0.25 pp-0.21 pp
DGS1010-year Treasury yield2026-11-054.84%-0.23 pp+0.22 pp+0.81 pp
HOUSTHousing starts2026-09-011,221k-5.2%-15.1%-7.4%
RSXFSRetail sales excluding food services2026-09-01$652.1bn+0.7%+1.5%+6.2%
UMCSENTUniversity of Michigan sentiment2026-09-0148.10-7.0%-2.8%-12.7%
INDPROIndustrial production2026-09-01103.95+0.7%+1.0%+2.2%
BAMLH0A0HYM2High-yield option-adjusted spread2026-11-053.48%+0.19 pp+0.71 pp+0.33 pp
ICSAInitial unemployment claims2026-10-31189k-2.5%-3.9%-13.8%
DCOILWTICOWTI crude oil spot price2026-11-03$99.64-2.2%+19.0%+66.2%
T10Y2Y10-year minus 2-year Treasury spread2026-11-060.35%-0.05 pp-0.13 pp-0.20 pp
JTSJOLJob openings2026-09-017,523k+4.6%+4.7%+4.9%

Trendlines and divergences

Where the signals disagree.

  • Strong payrolls, cautious turnover

    Evidence. October payrolls +165k; August openings 7.1m; hires 5.2m.

    Reading. Hiring recovered, but JOLTS still shows a less fluid labor market than the payroll headline alone suggests.

  • Firm activity, sticky monthly prices

    Evidence. Q3 GDP +3.4% SAAR; September PCE prices +0.5% m/m; ISM price indexes elevated.

    Reading. The growth-inflation mix leaves the Federal Reserve with limited room to ease.

  • Contained spreads, costly capital

    Evidence. High-yield spreads remain contained; Treasury and mortgage rates are elevated.

    Reading. Default risk is not the only hurdle. Higher discount rates and debt-service burdens still ration projects.

  • Consumer improvement, small-business caution

    Evidence. Conference Board 91.7 and Michigan 51.0 improved; NFIB 97.9 fell below its long-run average.

    Reading. Household attitudes improved from weak levels, while Main Street remains more cautious about expansion.

  • Trade demand, GDP arithmetic

    Evidence. Imports and exports both rose; deficit stayed at $105.0bn.

    Reading. Domestic absorption may be healthy while net exports remain a drag on measured output.

Policy, scenarios, and the calendar

Patience, and three ways it could go.

The baseline policy implication is patience rather than a pre-committed rate path. Real activity, payrolls and ISM readings argue against treating the economy as fragile. Monthly PCE-price pressure and elevated survey prices argue against declaring inflation finished. A turn in claims, a sustained fall in services-price measures, or a wider credit spread would change the balance more than a single market day.

The Treasury refunding statement announced $125 billion in securities to refund approximately $97 billion maturing November 15, raising roughly $28 billion in new cash. Financing supply is not the whole explanation for long yields, but it remains part of the backdrop for valuation and debt pricing.28

  • Resilient expansion

    45%

    Judgmental probability, share of 100%

    Triggers. Payroll growth stays positive; ISM stays above 50; claims stay low.

    Business and M&A. Strategic software deals continue; rate-sensitive multiples remain capped.

  • Sticky-inflation slowdown

    35%

    Judgmental probability, share of 100%

    Triggers. PCE and services prices stay elevated; mortgage and Treasury yields remain high; construction weakens.

    Business and M&A. More valuation gaps, earnouts, seller notes, and lower leverage.

  • Recession within 12 months

    20%

    Judgmental probability, share of 100%

    Triggers. Claims trend higher; job openings and payrolls weaken together; spreads widen materially.

    Business and M&A. Deal volume falls before consolidation and distress opportunities rise.

Judgmental recession-probability range: 15% to 25%, midpoint 20%. The positive curve, low claims, and firm activity data pull the estimate down; high financing costs, weak small-business optimism and the risk of continued price pressure prevent a lower range.

Next release cycle

  1. Nov. 10, 8:30 a.m.October CPITests whether September’s price pressure carried into October.
  2. Nov. 12, 8:30 a.m.October PPIInput-cost and margin-pressure read for goods and services.
  3. Nov. 17, 8:30 a.m.October retail sales and import/export pricesSeparates real demand from price effects; refreshes tariff and import-cost evidence.
  4. Nov. 18, 2:00 p.m.FOMC minutes for October 27-28 meetingClarifies the Committee’s reaction function after the hold.
  5. Nov. 18, 8:30 a.m.October housing startsRate-sensitive construction and supply read.
  6. Nov. 25, 8:30 a.m.October personal income and outlays; Q3 GDP second estimateCore PCE and consumption detail reset the policy debate.

The final summary

The economy’s awkward balance

The strong and the strained. Reporting window October 31 to November 6, 2026.

America’s economy entered November with an uncomfortable combination of strengths. Output grew at a 3.4% annualized pace in the third quarter. The first serious read on October employment showed payrolls rising by 165,000 and the unemployment rate unchanged at 4.1%. Manufacturing and services purchasing managers both reported expansion. This is not the data pattern of an economy that has already slipped into a downturn.1345671415161710

The awkward part is that activity strength has not brought a clean inflation victory. September nominal consumption rose 0.5%, but real consumption barely moved because the PCE price index also rose 0.5%. Core PCE increased 0.3%. The October ISM reports added another warning: manufacturing prices registered 75.2 and services prices 73.0. Those readings do not map mechanically into consumer inflation, but neither are they the raw material for easy central-bank reassurance.1345671415161710

The Federal Reserve held the target range at 3.75% to 4.00% at its October meeting. The week’s releases gave it little reason to reinterpret the economy as suddenly fragile. A steady policy rate is not neutral for companies. It means the discount-rate burden remains high even when credit spreads are calm. Buyers with scale and cash can live with it. Borrowers whose cases depend on cheap leverage cannot simply wish the base rate away.1345671415161710

The labor report deserves a second look. September had pointed to sluggish job creation. October was much better, and professional and business services made a large contribution. Yet JOLTS data still depict a lower-turnover labor market. Job openings, hires and quits have all cooled from prior-cycle highs. The question is whether October is the start of a renewed hiring run or a one-month reprieve in a labor market that has become less mobile. Claims will tell the faster part of that story.1345671415161710

Consumers also continue to confuse the picture. The Conference Board’s October confidence reading rose sharply to 91.7. Michigan’s preliminary November survey rose to 51.0. These moves matter, but both indexes are recovering from weak levels. NFIB optimism, which better represents the operating mood of smaller firms, slipped to 97.9 and fell below its long-run average. A national consumer can still spend while a small employer postpones expansion. That is exactly the distinction deal teams should make when assessing target-market exposure.1345671415161710

Housing is still transmitting high rates more directly than most other parts of the economy. A 7.24% 30-year mortgage rate, weaker construction spending and limited transaction activity leave housing-linked software and services exposed. Prices can rise in a supply-constrained market even when volume deteriorates, so asset-price data alone will not protect a thesis based on mortgage, title, homebuilding or contractor workflow volume.1345671415161710

Trade data add a final complication. September exports and imports both rose, and the deficit narrowed only slightly to $105.0 billion. Strong imports often indicate strong domestic demand, but net exports can still subtract from output. That is why a headline GDP number and an import number can seem to disagree. They are answering different questions, which macroeconomics has always found a way to make unnecessarily entertaining.1345671415161710

The central case is continued expansion with slower real consumption and persistent price pressure. The downside case is a late-cycle squeeze: high rates weigh on construction and smaller businesses, while inflation makes monetary relief difficult. The upside is that capital spending and productivity gains translate into more supply before cost pressure becomes embedded. The next CPI, PPI and PCE releases will determine which version of this uneasy balance is gaining ground.1345671415161710

Download the PDF (356 KB)

The PDF holds this summary and the M&A impact below, with the sources they cite.

For deal teams

M&A impact for mid-market software and software-enabled services

  1. 01

    The macro signal for software M&A is selective continuity, not a broad reopening. Strong Q3 GDP, a 3.4% Q4 GDPNow estimate, October job creation and expansionary ISM readings support buyer confidence in revenue demand. The October employment report is especially useful for software and services because professional and business services added 70,000 positions, including 33,000 in professional, scientific, and technical services. That does not prove a target’s growth will persist, but it weakens the claim that enterprise technology budgets are in an immediate general contraction.1235678101113142527

  2. 02

    The cost of capital remains the governing constraint. The federal-funds target is 3.75% to 4.00%, Treasury yields remain elevated, and Freddie Mac’s 30-year mortgage rate was 7.24% as of October 29. High-yield spreads may be contained, yet lower-mid-market borrowers price off both the risk-free curve and lender caution. Underwriting should therefore test debt-service coverage at a higher base rate, not just a wider spread. A spread chart that looks peaceful can conceal an expensive all-in coupon. Deals that depend on aggressive leverage or a fast multiple expansion should be treated as rate bets, not operating theses.1235678101113142527

  3. 03

    Valuation gaps will persist where sellers extrapolate top-line momentum and buyers capitalize lower free cash flow at a higher discount rate. The practical bridge remains structure: rollover equity, earnouts, seller notes, preferred equity, and staged acquisition rights. These tools should be tied to measurements that management can influence and that diligence can verify, such as gross retention, net retention, bookings quality, implementation backlog, gross margin, cloud-cost pass-through, and conversion of EBITDA into cash. Vague earnout language only converts a price disagreement into future litigation with better stationery.1235678101113142527

  4. 04

    Sector exposures differ. AI infrastructure, cybersecurity, data management, workflow automation, compliance, energy optimization and data-center services retain structural demand support from capex and risk management. The Treasury Borrowing Advisory Committee noted capex-led growth as a driver of the ten-year yield and did not find clear evidence that tech issuance was crowding out other credit. This supports diligence on the durability of AI-related budgets, though it is not permission to pay infrastructure multiples for thin application differentiation. Housing, mortgage, title, construction and small-business-exposed targets deserve lower near-term volume assumptions because high mortgage rates and weak construction spending are already visible in the macro data.1235678101113142527

  5. 05

    Buyer appetite should remain highest among strategic acquirers and sponsors with dry powder, modest portfolio leverage, and a credible route to post-close cash conversion. The September trade deficit, firm imports and services expansion support the revenue side of the case. PCE-price and ISM-prices readings require equal attention to the cost side. For each target, separate nominal price-led growth from unit or usage growth, and segment churn by customer size, financing sensitivity and vertical. A company can present healthy ARR while its smaller customers quietly ration seats, modules, projects or implementation work. That is where a respectable model becomes a very expensive anecdote.1235678101113142527

Sources and verification record

Every citation, in one place.

Distinct verified source URLs: 28. Sources with an in-window publication date of October 31 to November 6, 2026 or a current October 2026 observation/data-series page: 19 of 28 (67.9%). Primary or official sources: 25 of 28. The exception set consists of ISM, Conference Board, NFIB, Freddie Mac, FRED and the PRNewswire-hosted copy of ISM services; those are identified by publisher rather than represented as government data.

Embedded comparative chart count: 16. Data sources and as-of dates are printed in every chart source line; charts use FRED series through their most recent October or November 2026 observation and show a current 12-month window plus the immediately preceding aligned period. The report covers Conference Board Consumer Confidence, University of Michigan sentiment, NFIB optimism, ISM Manufacturing PMI, and ISM Services PMI. Michigan and Conference Board are included in the chart set where public FRED data are available.

All numbered inline citations and each source-list URL are embedded hyperlinks. Quality checks applied: no silent interpolation; monthly averages for daily and weekly series only; seasonally adjusted source conventions preserved; nominal retail sales labeled as nominal; data-vintage and release lag identified in the appendix. No source or value was created to fill a missing release.

Sources by publisher

Number of sources, n = 28. Reporting window October 31 to November 6, 2026.

  • BLS
    3
  • BEA
    2
  • ISM
    2
  • Census Bureau
    2
  • Federal Reserve
    2
  • Conference Board
    2
  • FRED
    2
  • BLS Employment Situation
    1
  • BLS Employment Situation Table B-1
    1
  • Atlanta Fed GDPNow
    1
  • Census Bureau and BEA
    1
  • U.S. Treasury
    1
  • Freddie Mac
    1
  • University of Michigan Surveys of Consumers
    1
  • NFIB
    1
  • Census Bureau and HUD
    1
  • FHFA
    1
  • U.S. Department of Labor
    1
  • Treasury Borrowing Advisory Committee minutes
    1
  • Treasury quarterly refunding statement
    1

Sources by evidence type

Number of sources, n = 28. Reporting window October 31 to November 6, 2026.

  • Official
    19
  • Survey
    7
  • Data series
    2
Table equivalent of both charts
Sources by publisher
publisherSources
BLS3
BEA2
ISM2
Census Bureau2
Federal Reserve2
Conference Board2
FRED2
BLS Employment Situation1
BLS Employment Situation Table B-11
Atlanta Fed GDPNow1
Census Bureau and BEA1
U.S. Treasury1
Freddie Mac1
University of Michigan Surveys of Consumers1
NFIB1
Census Bureau and HUD1
FHFA1
U.S. Department of Labor1
Treasury Borrowing Advisory Committee minutes1
Treasury quarterly refunding statement1
Sources by evidence type
TypeSources
OfficialGovernment or central-bank release19
SurveySurvey or association release7
Data seriesAggregated public data series2

Source: verification record, issue E-2026-11-07. Each source is counted once.

  1. 1BLS Employment Situation, October 2026, released November 6, 2026, 8:30 a.m. ETOfficialBLS Employment SituationBLS Employment Situation · BLS Employment Situation
  2. 2BLS Employment Situation Table B-1, October 2026, last modified November 6, 2026OfficialBLS Employment Situation Table B-1BLS Employment Situation Table B-1 · BLS Employment Situation Table B-1
  3. 3BEA, Personal Income and Outlays, September 2026, released October 29, 2026, 8:30 a.m. EDTOfficialBEABEA · BEA
  4. 4BEA, GDP advance estimate, third quarter 2026, released October 29, 2026, 8:30 a.m. EDTOfficialBEABEA · BEA
  5. 5Atlanta Fed GDPNow, Q4 2026 estimate, updated November 4, 2026OfficialAtlanta Fed GDPNowAtlanta Fed GDPNow · Atlanta Fed GDPNow
  6. 6ISM, October 2026 Manufacturing PMI report, released November 2, 2026, 10:00 a.m. ETSurveyISMISM · ISM
  7. 7ISM, October 2026 Services PMI report, released November 4, 2026, 10:00 a.m. ETSurveyISMISM · ISM
  8. 8Census Bureau, Monthly Construction Spending, September 2026, released November 2, 2026, 10:00 a.m. ETOfficialCensus BureauCensus Bureau · Census Bureau
  9. 9Census Bureau, Manufacturers’ Goods, September 2026, released November 3, 2026OfficialCensus BureauCensus Bureau · Census Bureau
  10. 10Census Bureau and BEA, International Trade in Goods and Services, September 2026, released November 4, 2026, 8:30 a.m. ETOfficialCensus Bureau and BEACensus Bureau and BEA · Census Bureau and BEA
  11. 11Federal Reserve, FOMC statement, October 28, 2026, released 2:00 p.m. EDTOfficialFederal ReserveFederal Reserve · Federal Reserve
  12. 12Federal Reserve, implementation note, October 28, 2026OfficialFederal ReserveFederal Reserve · Federal Reserve
  13. 13U.S. Treasury, daily par yield curve rate methodology and daily dataOfficialU.S. TreasuryU.S. Treasury · U.S. Treasury
  14. 14Freddie Mac, Primary Mortgage Market Survey, rate as of October 29, 2026SurveyFreddie MacFreddie Mac · Freddie Mac
  15. 15University of Michigan Surveys of Consumers, preliminary November 2026 resultsSurveyUniversity of Michigan Surveys of ConsumersUniversity of Michigan Surveys of Consumers · University of Michigan Surveys of Consumers
  16. 16Conference Board, Consumer Confidence Index, October 2026, updated October 27, 2026SurveyConference BoardConference Board · Conference Board
  17. 17NFIB, Small Business Optimism Index, September 2026, released October 13, 2026SurveyNFIBNFIB · NFIB
  18. 18Conference Board, US LEI, September 2026, released October 22, 2026, 10:00 a.m. ETSurveyConference BoardConference Board · Conference Board
  19. 19BLS, Consumer Price Index, September 2026, released October 14, 2026, 8:30 a.m. ETOfficialBLSBLS · BLS
  20. 20BLS, Producer Price Index, September 2026, released October 15, 2026, 8:30 a.m. ETOfficialBLSBLS · BLS
  21. 21BLS, Job Openings and Labor Turnover, August 2026, released September 29, 2026; September release scheduled November 3OfficialBLSBLS · BLS
  22. 22Census Bureau and HUD, New Residential Construction, September 2026, released October 20, 2026OfficialCensus Bureau and HUDCensus Bureau and HUD · Census Bureau and HUD
  23. 23FHFA, house price index, July 2026, released September 29, 2026OfficialFHFAFHFA · FHFA
  24. 24FRED, data catalog: key macro and market series used in charts, observations through October/November 2026Data seriesFREDFRED · FRED
  25. 25FRED, ICE BofA US High Yield Option-Adjusted SpreadData seriesFREDFRED · FRED
  26. 26U.S. Department of Labor, unemployment-insurance weekly claims releaseOfficialU.S. Department of LaborU.S. Department of Labor · U.S. Department of Labor
  27. 27Treasury Borrowing Advisory Committee minutes, November 3, 2026OfficialTreasury Borrowing Advisory Committee minutesTreasury Borrowing Advisory Committee minutes · Treasury Borrowing Advisory Committee minutes
  28. 28Treasury quarterly refunding statement, November 2026OfficialTreasury quarterly refunding statementTreasury quarterly refunding statement · Treasury quarterly refunding statement

All US Economy issues